Functionalities of Technology
FaSMEd introduced the third dimension ‘Functionalities of Technology’ with the aim of highlighting how technology can support the three agents involved in formative assessment (FA) processes when they activate the different FA strategies. Based on the FaSMEd classroom materials (tools) and the partners’ experiences in the use of technology to support formative assessment, this dimension is subdivided into three categories:
- Sending and Displaying,
- Processing and Analysing,
- Providing an Interactive Environment.
The “Sending and Displaying” category includes those functionalities of technology that support communication and fruitful discussions between the agents of FA processes. For example, the teacher sending questions to the students or displaying a student’s screen to show his/her work to the whole class. Several other functionalities such as sending messages, files, answers or displaying students’ worksheets belong in this category.
For example, the University of Newcastle Upon Tyne implemented interactive whiteboards with a reflector technology into classrooms. While students worked on the tool Designing Candy Cartons on their iPads, the technology makes it possible to display a student’s screen to the whole class, sharing his/her work, while making it possible to annotate and comment visibly in real time: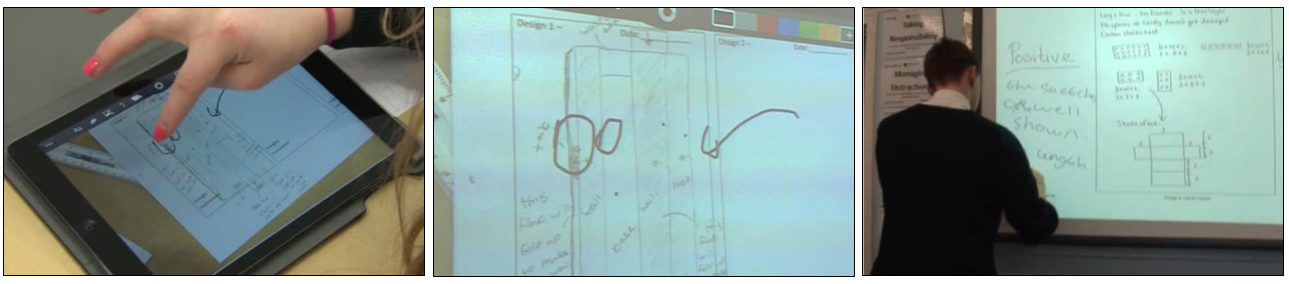
Another example of technology used for formative assessment in its functionalities of Sending & Displaying is provided by the University of Maynooth. They used the online platform Schoology, for example in the science tool Insulation, in classrooms as a way for teachers and students to communicate: sharing materials, learners uploading their work, teachers sending out tasks, but also to give feedback and ask questions: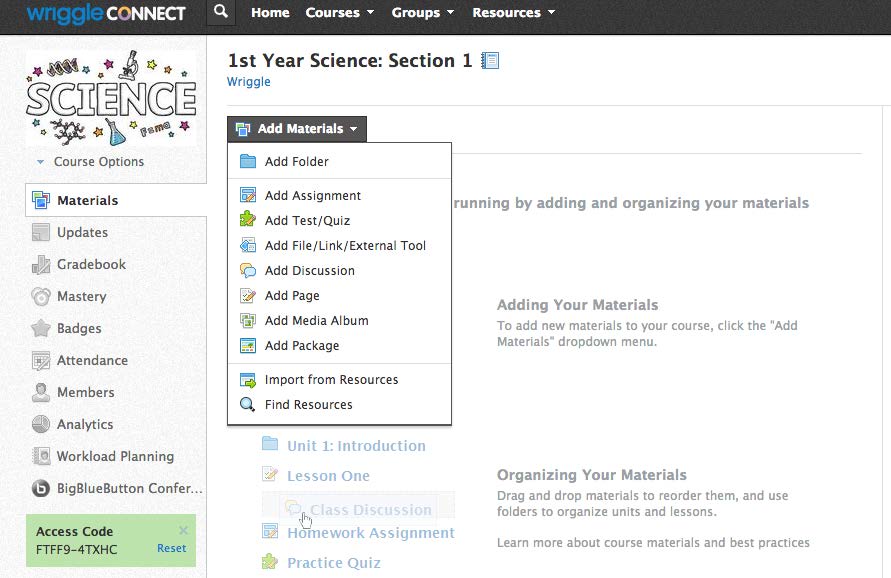
The functionalities that support the agents in the processing and analysis of the data collected during the lessons are included in the category “Processing and Analysing”. This could include a software that generates feedback based on a learner’s answer or an application which creates statistical overviews of solutions of a whole class, e.g. in a diagram or table. Other examples are the generation of statistics of students’ answers to quick polls or questionnaires as well as the tracking of students’ learning paths.
For example, in the tool Unit of length developed by the University College of Trondheim, Norway, the applet Kahoot is used for sending questions to students, learners sending their answers to the teacher and the teacher displaying the students’ solutions to discuss and give feedback. What is more, the technology produces a statical overview represented in a bar diagram of the whole class’ answers and therefore helping students and the teacher to grasp all students’ solutions at once: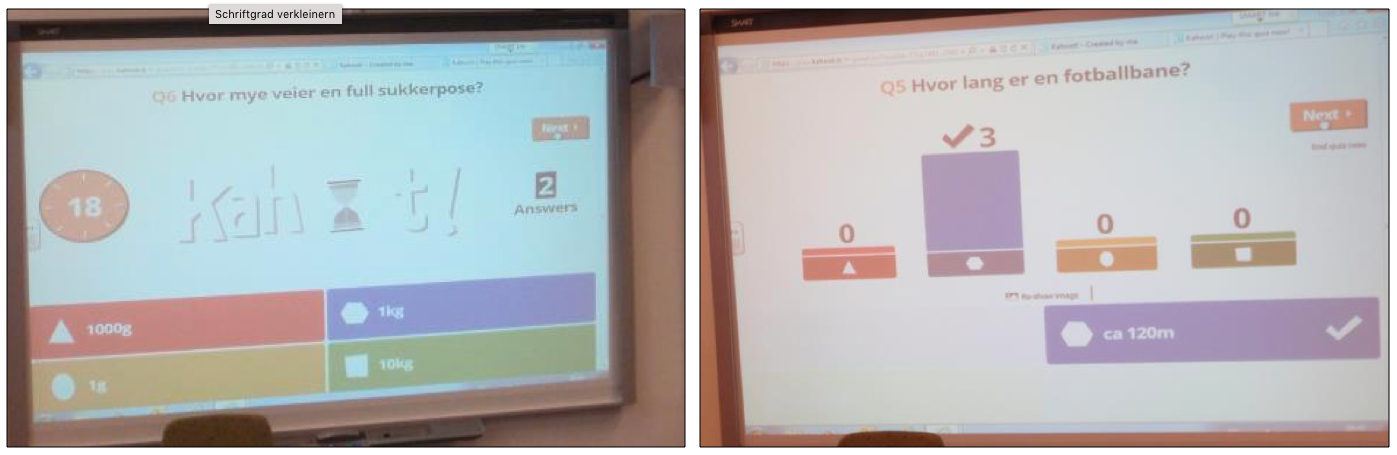
Another example of this functionility is the tool Equivalence of fractions developed at Ecole Normale Superieure De Lyon, France. It uses a student response system (Je leve la main) to display a question to the whole class, which each learner then answers individually via a remote control. Then, the technology analysis the answers indicating in green or red colour weather a student’s solution was correct and shows what the answer of each individual student was. The teacher can finally display all the sent in solutions to discuss the problem with the whole class and give feedback: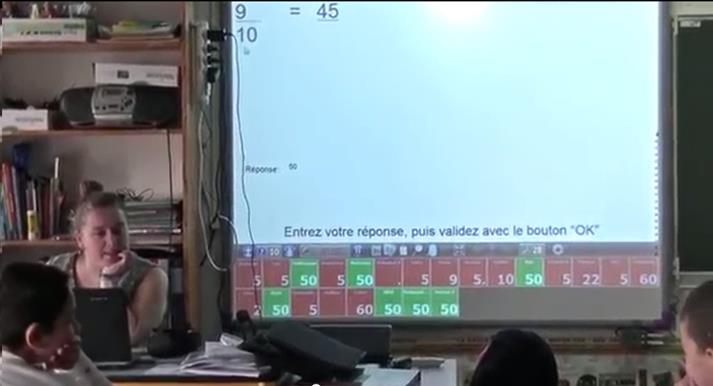
The third category, “Providing an Interactive Environment”, refers to those functionalities of technology that enable to create a shared interactive environment within which students can work individually or collaboratively on a task or a learning environment where mathematical/scientific contents can be explored. This category includes, for example, shared worksheets, Geogebra files, graph plotting tools, spread sheets, dynamic representations or ChemSketch models.
For example, the digital self-assessment tool Can I sketch a graph based on a given situation? developed at the University of Duisburg-Essen functions as an interactive environment, in which students can explore the mathematical content of sketching a graph dynamically and assess their own work based on a presented check-list: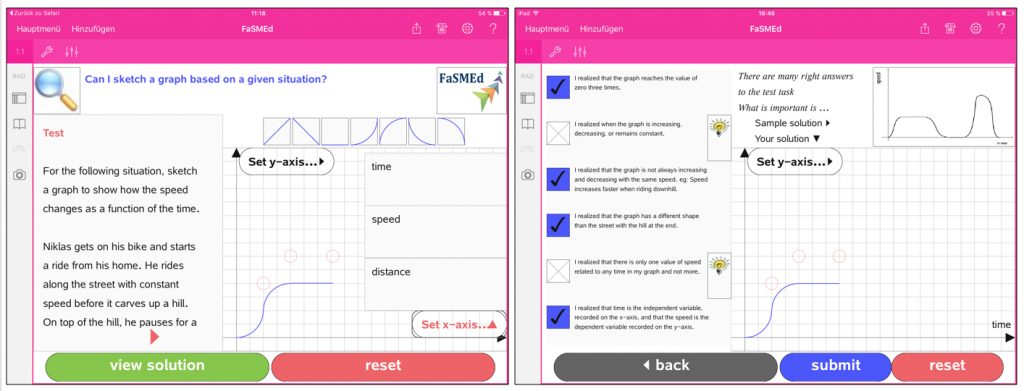
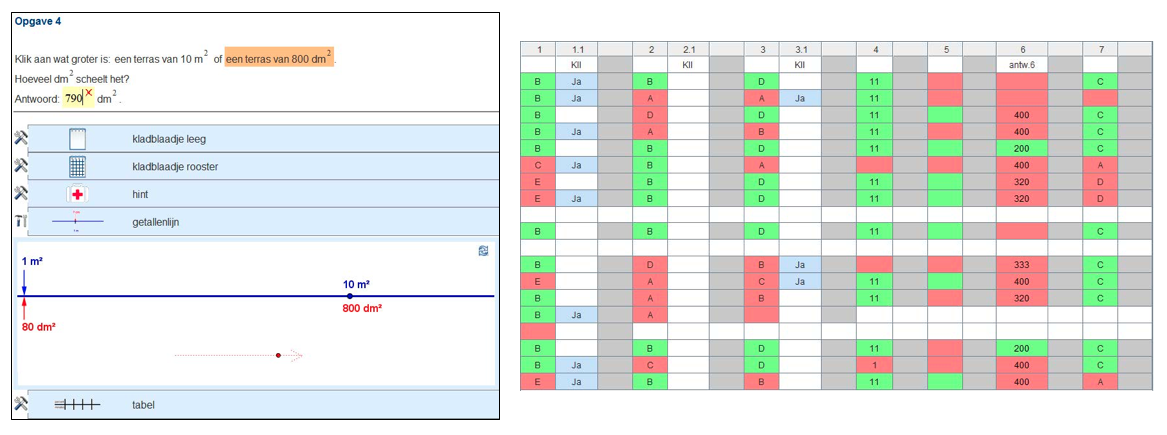
Another example of technology used for formative assessment in its functionality of Providing an Interactive Environment was designed by Utrecht University. They created four different modules in an online Digital Assessment Environment (DAE), for instance one on the metric system. Within this environment, learners work on a series of questions while being able to choose between a number of different tools to help them solve a problem, like tables, scrap papers, hints, percentage bars, etc. The technology then presents an overview of the students’ work, their chosen tools and answers to the teacher, who can use this data formatively: