Dr David Hope reflects on using ArcGIS StoryMaps as a summative assessment for a second-year undergraduate module and offers practical advice and inspiration for colleagues interested in the potential of this digital tool as a form of authentic assessment.
Our opportunity
When designing a new Stage 2 module ‘Global Environmental History: From the Little Ice Age to Greta Thunberg’ (HIS2321), my colleagues and I were keen to offer an assessment that gave students the opportunity to do something creative and not yet another history essay. We wanted something that would require learners to engage with a wide array of multimedia (or types of historical sources), practice their digital skills, engage audiences in historical research, and think more about the importance of space and place.
The module ran in the 2021/22 and 2022/23 academic years and was taken by around 30 undergraduate students. These students were largely from the single honours History (V100) programme.
Our solution (approach)
ArcGIS StoryMaps offers an engaging way for students to practice digital storytelling, digital literacy, and digital creativity. This simple online content builder allows users to add maps, text, images, audio, timelines, tables, videos, and embed social media posts, web pages, and code to create digital stories that are interactive, professional, and easy to share.
This made it ideally suited as the final summative assessment (60% weighting, 2000 words equivalent) for the new module where we wanted students to reflect on the historical roots of a present-day environmental issue and/or a key theme in environmental history.
We expected students to formulate their own ideas for what their StoryMap should explore but provided scaffolding to support its creation.
Scaffolded Support
Four 60-minute workshops guided students through the process of creating a well-structured and engaging StoryMap. We covered effective storytelling techniques and used a ‘learn through play’ approach to introduce students to the ArcGIS StoryMaps platform which involved the students using the features to create a story about themselves or their university journey. The workshops were facilitated by me together with Dr Clare Hickman and Dr Joseph Lawson.
Students submitted a formative creative project plan several weeks before the final deadline that outlined the structure, focus, argument, primary sources, and data visualisations they intended to use in their StoryMaps. While the students received written feedback from me on their submitted plans, they also presented their plans in one of the workshops so they could receive and provide formative feedback from and to their peers.
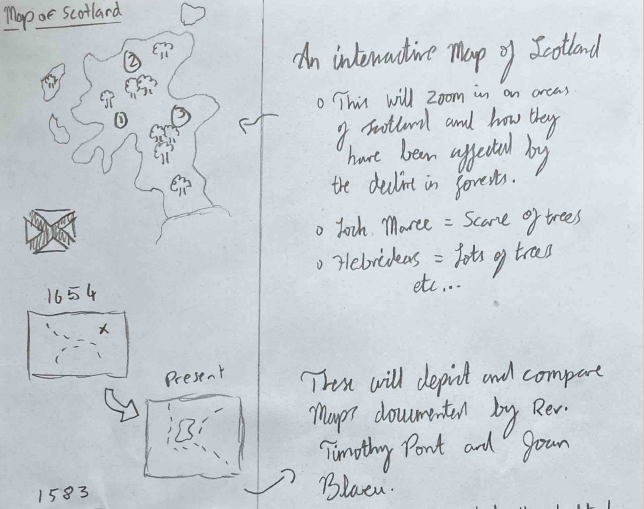
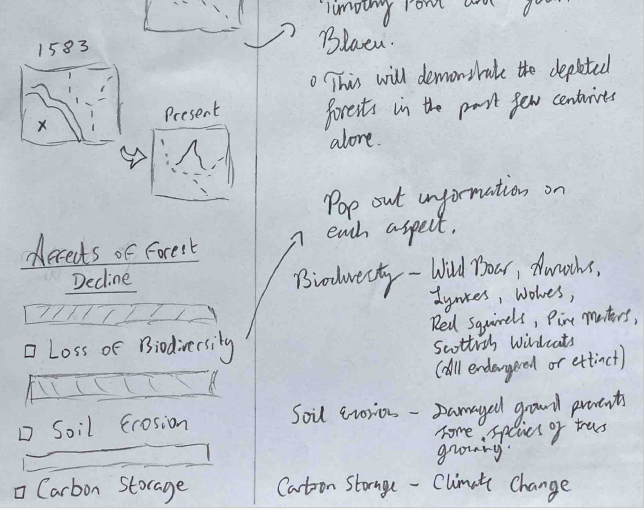
Part of the handwritten storyboard used by student Tom Stewart to plan their StoryMap
I also created a specific marking criteria for the StoryMap assessment which included three core areas — Argument, Evidence, Presentation & Design — and these sub-headings were used in the post-submission feedback.
Getting access to ArcGIS StoryMaps
The university already has a subscription to the ArcGIS suite of tools and students/staff can quickly get access to ArcGIS StoryMaps by following a few simple steps:
- Navigate to https://storymaps.arcgis.com/
- Click the ‘Sign in’ button
- Select ‘Your ArcGIS organization’s URL’ sign-in option and add ‘ncluni’ to the box
- Select the ‘Newcastle University’ button on the new screen
- Enter your Newcastle University login details
- Once authenticated, users will be automatically logged in to ArcGIS StoryMaps
Submitting an ArcGIS StoryMap
To submit their created StoryMaps for assessment, students attached a PDF version of their StoryMap to their submission in Canvas and then posted the link to the online version of their StoryMap in a comment on their submission. The PDF file served as a backup in case anything happened to the online version and as a record of their submission held on Canvas for Quality Assurance purposes.
I talked students through the submission process in class and provided a step-by-step video of me talking through the process so students could refer to it when they came to submit their completed StoryMaps. This guidance worked effectively as students successfully submitted their work and I did not receive any last-minute submission-related queries.
Archiving the StoryMaps
Once the students had submitted their StoryMaps, I changed the ownership of them from the students’ own ArcGIS Online accounts to my own. This prevented modifications to the StoryMaps after the assessment deadline and simultaneously ‘archived’ them by ensuring that the StoryMaps would remain live after the students graduated.
The impact (results)
ArcGIS StoryMaps provided an effective way to assess students understanding of global environmental history, and the platform is intuitive enough for newcomers to pick up and the produced StoryMaps are fun to create and mark. Dr Clare Hickman’s prior experience of using an earlier version of ArcGIS StoryMaps (ESRI StoryMaps) from a pilot teaching initiative at the University of Chester made using the platform as a form of assessment a less daunting prospect.
The StoryMaps enabled the students to practice their digital skills — providing a more authentic form of assessment than the standard history essay — and we were able to archive the students’ StoryMaps so that they could add them to their CVs and share with others. While it was not a major consideration back in 2021/22, a digital creative project like ArcGIS StoryMaps is also more difficult to ‘cheat’ with AI.
It was brilliant to see the creativity and independent thought the students demonstrated through their choice of topics, resources, and forms of communication. Students addressed issues ranging from flooding in Kerala (India), the Netherlands, or North Yorkshire to oil spills in the Ecuadorian Amazon, deforestation in Scotland, and Western imperialist attitudes to the world’s highest mountain.
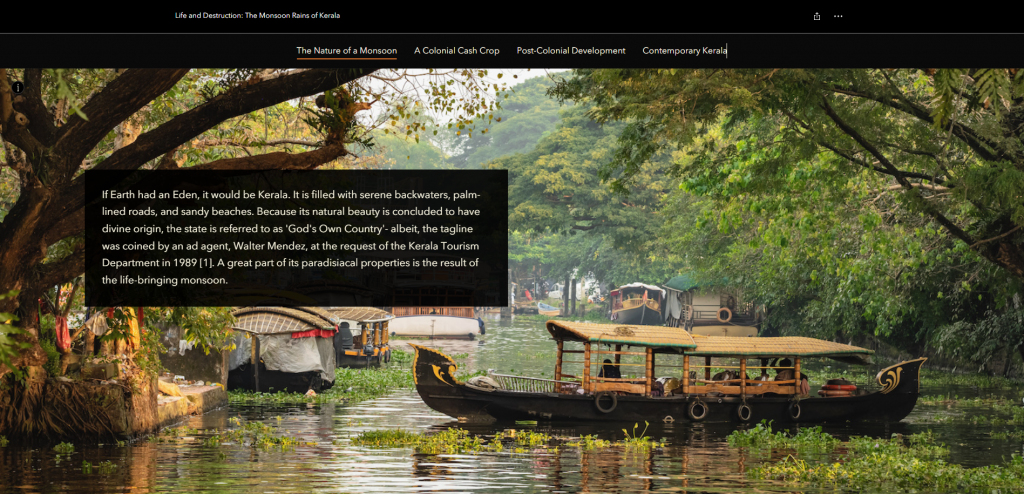
Part of student Lima Assi’s StoryMap
Students used satellite imagery and Ordinance Survey maps to show changes in land use and embedded YouTube videos to explain scientific concepts like cloudbursts and why peat matters. All of the students used and analysed a range of historical sources — including photographs, advertising posters, newspapers, literature, documentary video clips, and tweets — to communicate a compelling story (argument) while maintaining audience attention with immersive timelines, map tours, and even interactive plug-ins like NUKEMAP.
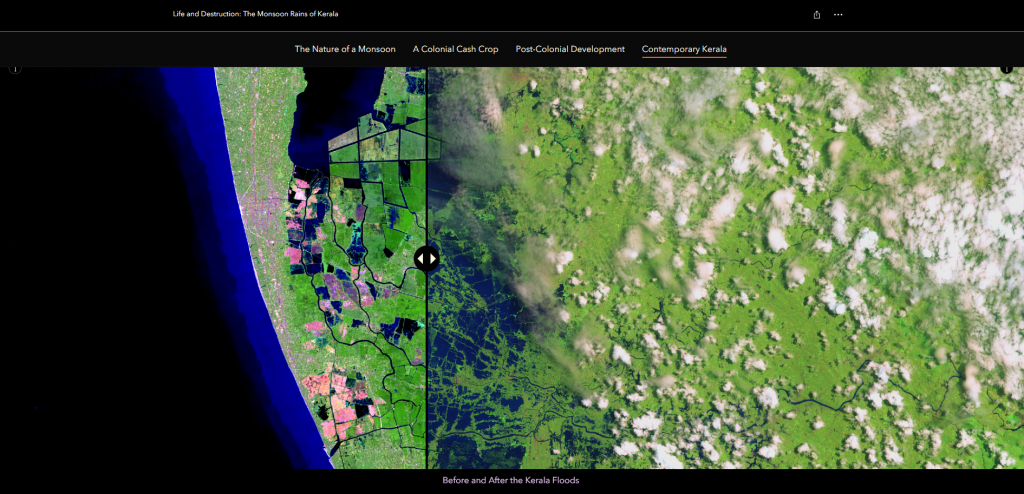
A StoryMap using a Before and After Slider to highlight flood effects in Kerala
Student feedback
Students highly commended the process of creating a StoryMap as being fun, while recognising it as a valuable (and somewhat rare) opportunity for them to practice digital and other relevant skills for the workplace. Some students went as far as to call it the ‘best assessment’ they had completed so far or that it was the first time they had enjoyed doing an assessment.
Student participation throughout the module and their produced final work showed that digital StoryMaps — like other types of creative projects — can stimulate higher student engagement. This was the case for all students and not just the top-performers. Several colleagues not involved in the delivery of the module informed me that students had proudly shown them what they had created, and some students later chose to create a StoryMap as part of their assessment for a Stage 3 module.
A few students have been keen to share their experiences of creating an ArcGIS StoryMap in conference presentations such as at Newcastle University’s Learning and Teaching Conference 2024 and History UK’s ‘Experiential Learning in History’ workshop at Northumbria University in July 2023. Even a few years after the module ran, students still recall the assessment as shared by Lima and Tom in their reflections below.
Lima Assi, Newcastle History graduate who took the module in 2021/22 academic year:
“Creating an ArcGIS StoryMap developed my digital literacy, presentation, and storytelling skills. Doing this assessment opened up so many avenues for me; the skills I developed aided me in getting a Digital Education internship and getting a grant for a Climate Research Scholarship project – during which I created another StoryMap (of my own free will!). I link these StoryMaps on every CV. I highly encourage the use of unconventional digital assessments to prepare students for their future careers in this digital world.”
Tom Stewart, Newcastle History graduate who took the module in 2022/23 academic year:
“I found ArcGIS StoryMaps both accessible and enjoyable to use. It allowed me to develop my storytelling skills in a way that complemented my history degree — using a narrative structure made my research more engaging and easier to understand. I have referenced my StoryMaps work in my CVs and personal statements, and I’m personally very proud of it. The user-friendly interface made it easy to share my work with friends and family, who rarely get to engage with my research. I would highly recommend StoryMaps as a unique and engaging way to present research. They encourage a more dynamic and visual approach to analysis, making complex information easier to understand. It was the most fun and creative project I worked on during university.”
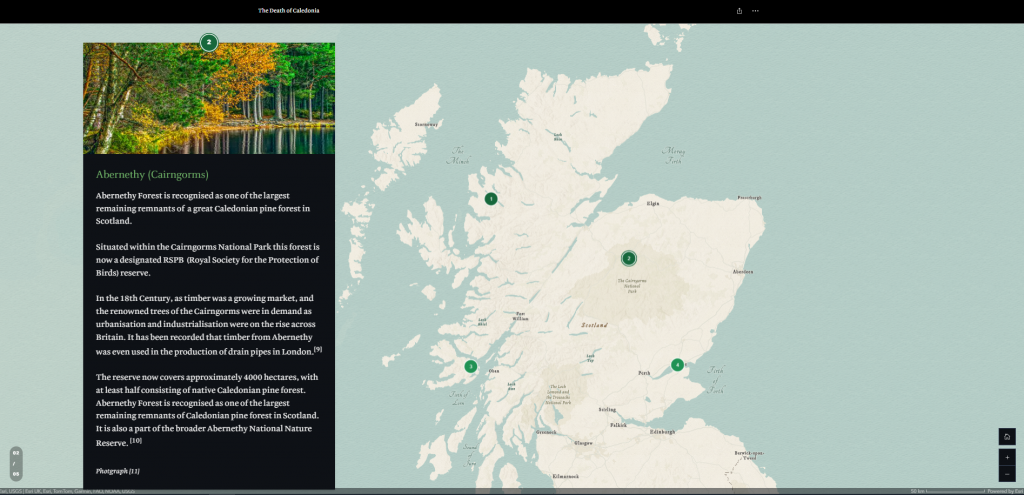
A section of Tom’s StoryMap
Lessons learned
The workshops were crucial in getting the students comfortable with using ArcGIS StoryMaps and allaying any anxieties as was providing clear submission instructions. Through co-creating presentations with students about the assessment and reviewing module feedback, there are a few ways the assessment could have worked even better:
- Provide more guidance on the intended audience – rather than leaving this entirely open for the students to select we could have provided a few real-world scenarios for them to choose from (e.g. the next COP summit is looking for a series of digital stories on the history of human-environment relationships to include in a public exhibition aimed at a general audience).
- Use a storyboard as the formative project plan – a storyboard is an effective way to plan out a StoryMap and is a great tool to introduce to students.
- Integrate digital accessibility training – we could have supported students to develop their digital accessibility skills (and wider EDI awareness) by signposting resources such as the ESRI StoryMaps Team guide to accessible storytelling.
- Embed skills reflection – we could have been more explicit with supporting students to identify and communicate the skills they had developed by creating a StoryMap (e.g. through submitting a short reflection with their StoryMap or pointing out the skills they had developed in the provided feedback).
Tips for colleagues
I would be careful about getting too bogged down in teaching students how to do specific things in ArcGIS StoryMaps unless the learning outcomes specifically require students to demonstrate that they can analyse complex spatial data. That certainly was not necessary for our Stage 2 History students and part of the appeal of using ArcGIS StoryMaps is that its digital functions are intuitive enough for students to explore and experiment with in their own time.
For undergraduate programmes that do not offer students many opportunities to produce something creative, Stage 2 is a nice time to introduce something like a StoryMap. I suspect final year students would be more hesitant to undertake an assessment type they were unfamiliar with, and it might be a bit too daunting for first years still getting to grips with their chosen subject.
Skills and attributes
Students were able to develop the following attributes:
- Self-management
- Self-directed learning
- Critical thinking
- Creative thinking
- Digital skills
- Communication
- Insight
- Future focused
Education for Life Strategy
This case study reflects the following aims of the Education for Life strategy:
- Fit for the future: To ensure our students are fit for their future, our teaching is fit for the future of our offer, and our colleagues are fit for the future of HE
Further resources
- L&T Conference 2024 recording – Digital Storytelling and Authentic Assessment: Using ArcGIS StoryMaps in the Classroom
- L&T Conference 2024 PowerPoint
- Student example 1: Lima’s StoryMap (shared with permission)
- Student example 2: Tom’s StoryMap (shared with permission)
Author
 |
Dr David Hope Learning Design & Curriculum Development Adviser Learning and Teaching Development Service david.hope@newcastle.ac.uk |