Dr Lucy Hatt (Senior Lecturer)
Newcastle University Business School
Faculty of Humanities and Social Sciences
What did you do?
As part of a doctoral research study, concept mapping workshops were conducted to evaluate what students thought they needed to understand in order to understand entrepreneurship through the lens of previously identified candidate entrepreneurship threshold concepts.
Who is involved?
Dr Lucy Hatt, and forty eight students across all years of an undergraduate entrepreneurship programme.
How did you do it?
Two concept-mapping workshops were conducted with forty-eight volunteer business school students from a population of one hundred and twenty-one across three years of an undergraduate entrepreneurship programme. In the workshops, small groups were asked to develop concept maps around the focus question, “What do you need to understand in order to understand entrepreneurship?” Participants came up with concepts that expressed what they thought needed to be understood in order to understand entrepreneurship and wrote these on sticky notes, they then positioned the sticky notes relative to each other on flip charts, and added connecting lines and linking statements to construct concept maps. They indicated if each concept on their map was ‘easy’ or ‘difficult’ to ‘get their head around’, and if they felt they had understood each one or not, as indicators of troublesomeness. They were also asked to indicate if any concepts on their maps were threshold concepts, after having been introduced to the threshold concept framework. Photographs were taken of each map, and each map was recreated in a digital form using Cmap software, (Florida Institute for Human and Machine Cognition, IHMC) to facilitate legibility and analysis. Areas of the digital versions of the maps which included concepts that related to the entrepreneurship CTCs developed in the two preceding stages of the research were shaded, again to facilitate analysis.
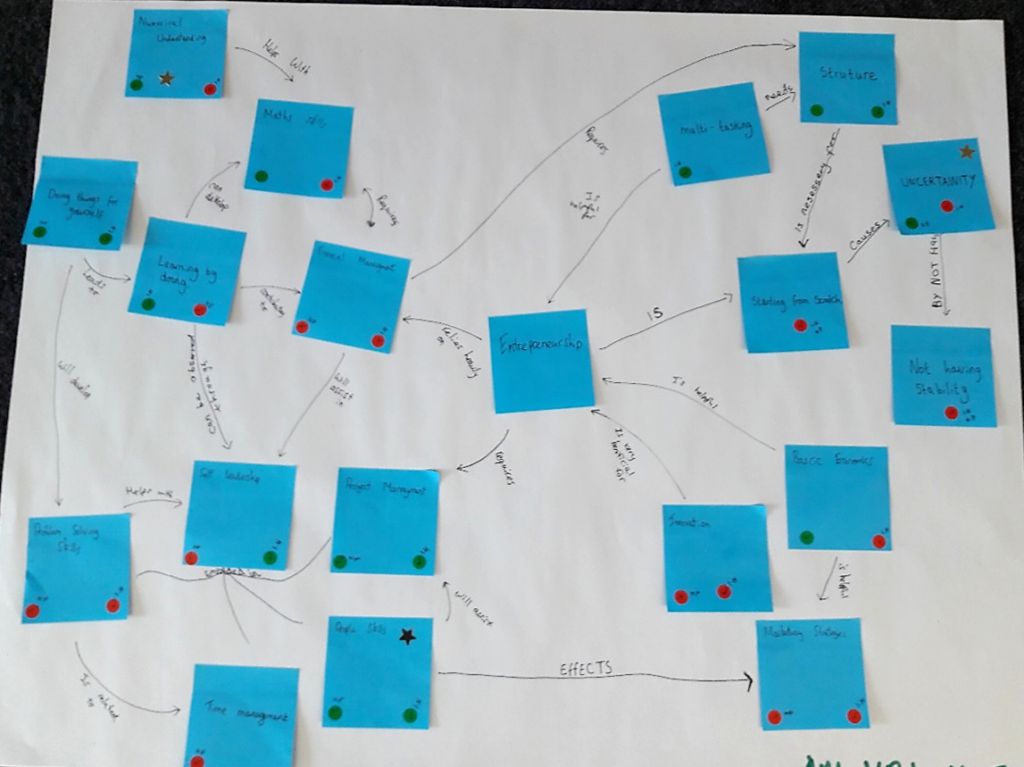
Example of a concept map
The students found the tasks they were set in the workshop challenging and demanding. Most students visibly chose to engage with the task and found it interesting, but others disengaged finding intrinsic motivation a struggle. The concept maps were analysed qualitatively and quantitatively in order that richness of what they represented might be explored as fully as possible. The structure, content and degree of integration shown in the maps were analysed as they were all potentially useful indicators of the students’ understanding of entrepreneurship and how it changed over the degree course. Map structure and integration were used to indicate level of understanding (Kinchin & Correia, 2017). Map content was used to correlate the extent of the students’ perceptions of entrepreneurship with those of the entrepreneurship CTCs. The nature of the linking words and phrases was also used to explore the students’ level of understanding. Data was analysed qualitatively to explore the degree of knowledge integration and adaptive expertise. Data was analysed quantitatively to indicate the level and nature of the students’ content knowledge. The number of concepts included in the maps overall, and the number of concepts that could be respectively associated with entrepreneurship CTCs were counted. Differences in the correlation of the students’ perception of entrepreneurship relative to the entrepreneurship CTCs by year of study became apparent. Data on troublesomeness was collected by counting the number of concepts coded “easy” or “hard” and the number of concepts that the students felt they had understood or not. The overall quality of each concept map was drawn from the quality of its structure and the quality of its content. The quality of structure of each map was evaluated based on the layout of the concept map and its explanatory power. The quality of content of each map was evaluated based on the number of entrepreneurship threshold concepts the concepts on the map could be linked to.
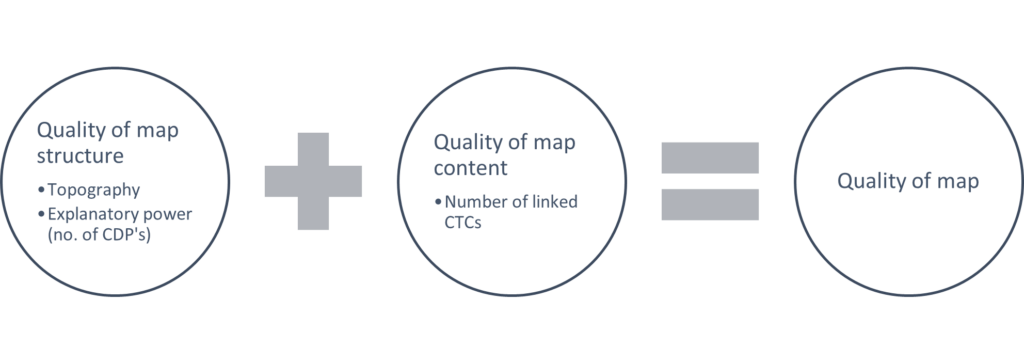
Quality of concept maps
Why did you do it?
The challenges associated with involving students in threshold concept research are well documented and to date the student voice has been largely absent from threshold concept research (Felten, 2016) despite the fact that student voices are recognised as useful in informing curriculum development (Scott, 2017). This approach permits the inclusion of the student voice in threshold concept research by using concept mapping with students to validate and verify threshold concepts, noting that interactions of this nature with students have more support (Barradell, 2013).
Concept mapping is a tool for visualising the interrelationships between concepts in an integrated, hierarchical manner and requires the identification and prioritisation of key concepts and principles. It allows issues of integration, and tacit knowledge and understanding to be made explicit (Kinchin et al., 2011). It is informed by assimilation theory (Ausubel, Novak, & Hanesian, 1968) and constructivist epistemology. Concept mapping allows attention to be paid to both how material is taught and how it will be learned, enables a conceptually transparent curriculum (Novak, 1991) and supports learning (Kinchin et al., 2011).
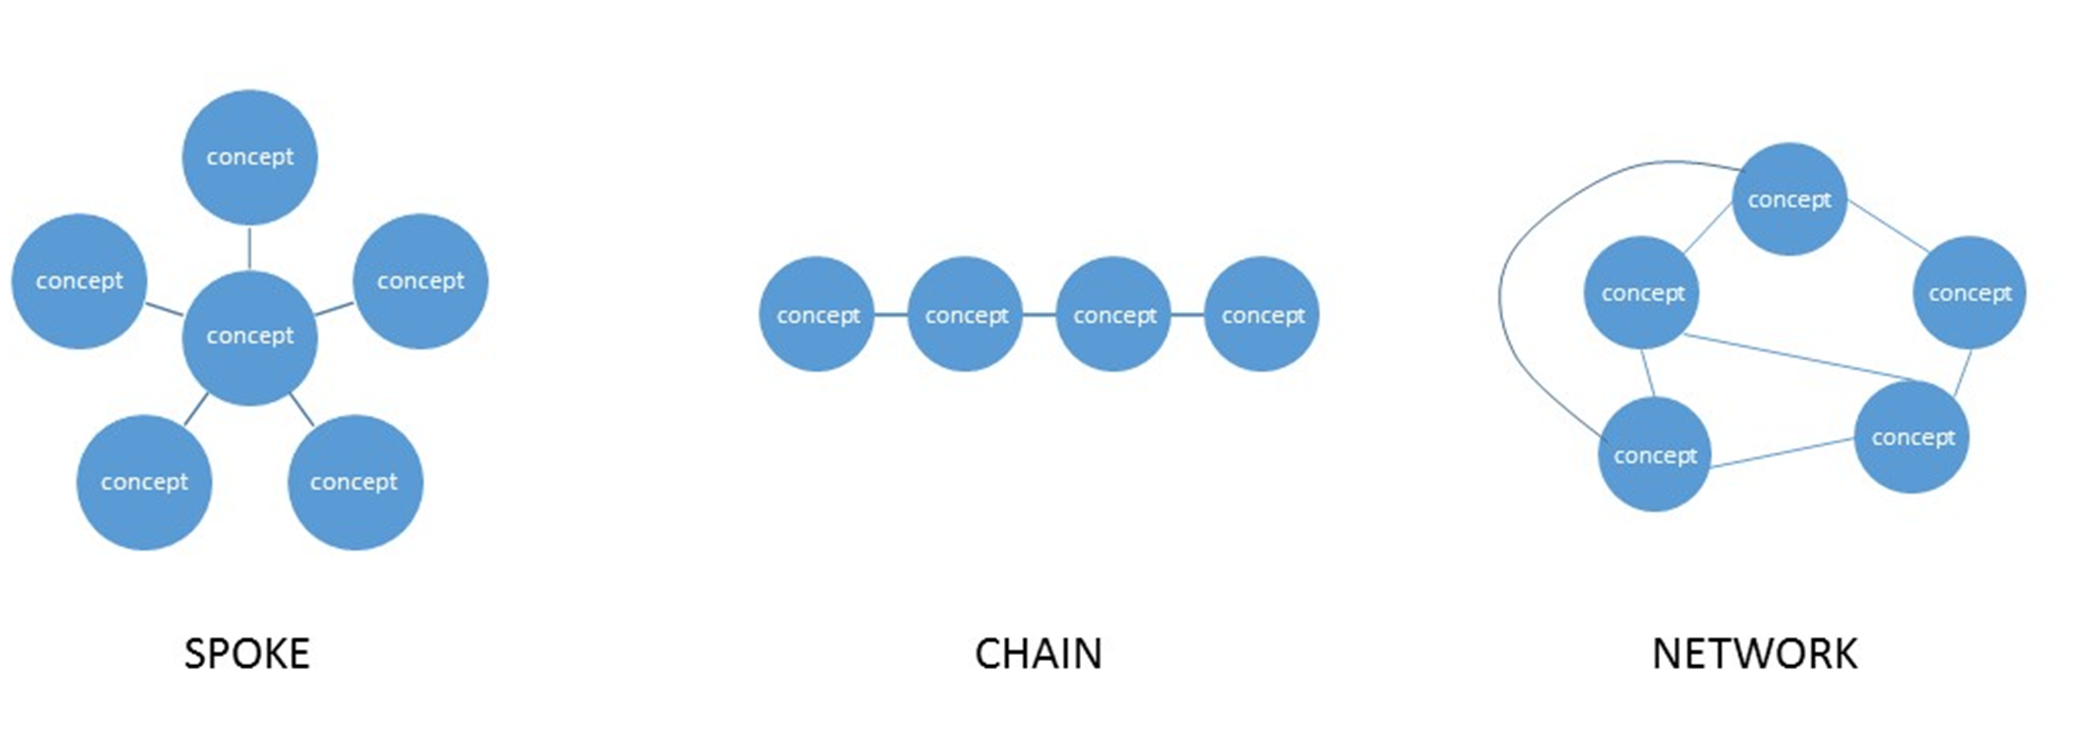
Concept map structure types
It has been highlighted as a particularly useful approach to interdisciplinary and multidimensional curricula development as it can facilitate the integration of content from several disciplines (Edmondson, 1995). “Concept maps facilitate meaningful learning by making conceptual relationships explicit, serving as advance organisers to subsequent learning and highlighting misconceptions and alternative frameworks” (Edmondson, 1995, p. 4). Concept mapping has previously been used in both research and teaching applications in education in order to make tacit and abstract knowledge visible and to assess conceptual development over time (Reimann & Sadler, 2017). It is also useful in enhancing teaching quality (Hay, Kinchin, & Lygo‐Baker, 2008).
Does it work?
The concepts maps from students from different year groups on the programme showed a progression of understanding. Accepting that this is not a generalisable outcome, the concept mapping method gave a useful insight into how this group of students was progressing on their programme. Concept mapping is a useful technique for educators who want to “see inside the heads” of their students without the normal filtering distortion of formative and summative assessment.
In the first year groups, two maps had a poor quality of structure and one a good quality of map structure. In the second year groups, three maps have a poor quality of map structure and one a good quality of map structure. In the third year, one group has a poor map structure, one a good map structure and two an excellent map structure. In the first year, one map has a poor quality of content and two a good quality of content. In the second year groups, one map has a poor quality of content and three a good quality of content. In the third year, all groups have a good quality of content. It appears that students’ development of an understanding of the knowledge content of entrepreneurship develops more rapidly but plateaus, in comparison to their development of an understanding of the knowledge structure over the three year degree programme.
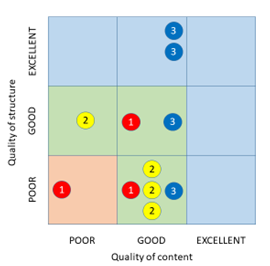
Concept map quality plotted over a 3 year degree programme
It appears that the students are deepening their understanding of the limited range of entrepreneurship threshold concepts that have come into view over the programme, but they are not developing awareness or understanding of the comprehensive set of entrepreneurship threshold concepts as identified in the previous two stages of the research.
Graduate Framework
The project develops the following attributes:
- Critical thinkers
- Creative, innovative and enterprising
- Collaborative
- Engaged
Want to know more?
Full details of the doctoral study can be found here: http://etheses.dur.ac.uk/13507/
Useful reference on Concept Mapping: Kinchin, I. M. (2016). Visualising powerful knowledge to develop the expert student: A knowledge structures perspective on teaching and learning at university.
References
AUSUBEL, D. P., NOVAK, J. D. & HANESIAN, H. 1968. Educational psychology: A cognitive view, New York, Holt, Rinehart & Winston.
BARRADELL, S. 2013. The identification of threshold concepts: A review of theoretical complexities and methodological challenges. Higher Education, 65, 265-276.
EDMONDSON, K. M. 1995. Concept mapping for the development of medical curricula. Journal of Research in Science Teaching, 32, 777-793.
FELTEN, P. 2016. On the thresholds with students. In: LAND, R., MEYER, J. H. F. & FLANAGAN, M. T. (eds.) Threshold Concepts in Practice. Rotterdam, The Netherlands: Sense Publishing.
HAY, D. B., KINCHIN, I. M. & LYGO‐BAKER, S. 2008. Making learning visible: the role of concept mapping in higher education. Studies in higher education, 33, 295-311.
KINCHIN, I. M., CABOT, L. B., KOBUS, M. & WOOLFORD, M. 2011. Threshold concepts in dental education. European Journal of Dental Education, 15, 210-215.
KINCHIN, I. M. & CORREIA, P. R. 2017. Editorial: Pedagogic frailty and concept mapping. Knowledge Management & E-Learning: An International Journal, 9, 254-260.
NOVAK, J. 1991. Clarify with concept maps. The science teacher, 58, 44.
NOVAK, J. & CAÑAS, A. 2008. The theory underlying concept maps and how to construct and use them. IHMC CmapTools. Florida Institute for Human and Machine Cognition.
REIMANN, N. & SADLER, I. 2017. Personal understanding of assessment and the link to assessment practice: the perspectives of higher education staff. Assessment & Evaluation in Higher Education, 42, 724-736.
SCOTT, R. E. 2017. Transformative? Integrative? Troublesome? Undergraduate student reflections on information literacy threshold concepts. Communications in Information Literacy, 11, 3.