Dr Angela Mazzetti (Senior Lecturer in Management Practice) and Liv Jonassen (Academic Skills Development Manager)
Newcastle University Business School and Library
Faculty of Humanities and Social Sciences and Academic Services
What did you do?
In this case study, we explore partnership working between the BUS2040 module leader and the Academic Skills Team in the production of a set of infographic assessment support videos. The BUS2040, HRM and the Future of Work, is a compulsory module on the BA Hons Business Management programme. Approximately 250 students study this module each year. The module is professionally accredited by the Chartered Institute of Personnel and Development, and as such, the module assessments must be designed to develop authentic work-related skills. Building on the trend towards using infographics in industry to succinctly deliver key information, the module has an infographic assessment component.
As part of the annual module review process, the team identified that the students would benefit from additional guidance on:
- how to design an impactful infographic; and
- the technical aspects related to the use of different software packages.
As such, the Module Leader and the Academic Skills team worked in partnership to develop a set of step-by-step video resources to take students through the process of designing and producing an impactful infographic poster. In this case study, we explain the process and discuss the value of working in partnership to develop student-centred assessment support.
Who is involved?
The BUS2040 Module Leader, Dr Angela Mazzetti and the Academic Skills Team Manager, Liv Jonassen.
How did you do it?
The Academic Skills Team met with the BUS2040 Module Leader to discuss the assessment for the upcoming academic year 2021/2022. We could see an opportunity to create resources to support students to create infographic posters to support the module assessment. The process began by meeting the Module Leader to discuss the assessment requirements of the task and to identify some of the issues that students encountered. This was then used as a basis to map out a Canvas course which covered the stages involved in creating an infographic.
Throughout our resources and teaching we encourage students to consider learning as a process, thus we wanted to reflect this in the resources created for the module. We wanted to make students aware that when creating a digital artefact such as an infographic, several stages are required and that scripting, planning and considering colours were important first steps. We also wanted to make it clear that due to the nature of the infographic, making informed decisions at the beginning of the process was important in order to avoid recreating work.
Modelling behaviour is also important, thus we wanted to include work along videos where the learning technologist used a mixture of screen cast and voiceover to go through the process of creating an infographic using two types of software, Canva and PowerPoint. It was felt that giving students a choice of software was important in terms of accessibility. This approach was also used so that students could access the support suitable to their level of expertise, recognising that this was likely to vary across the cohort.
Content was first drafted and reviewed, and then scripts were created for a series of short videos, mirroring the process of creating an infographic. Each video consisted of a PowerPoint presentation with a voiceover recorded using ReCap software and then uploaded into Microsoft Stream. In addition, to illustrate the process of converting images to work in Canva, a screencast was created showing students the process of converting assets from one format to another. The completed videos were shared and added to the module Canvas site.
The videos were all designed to be brief, and most range from 2-4 minutes. Each section builds on from the next, which was designed for students “to dip in and dip out of” the sections. The titles of the videos are presented below in Figure 1 below.
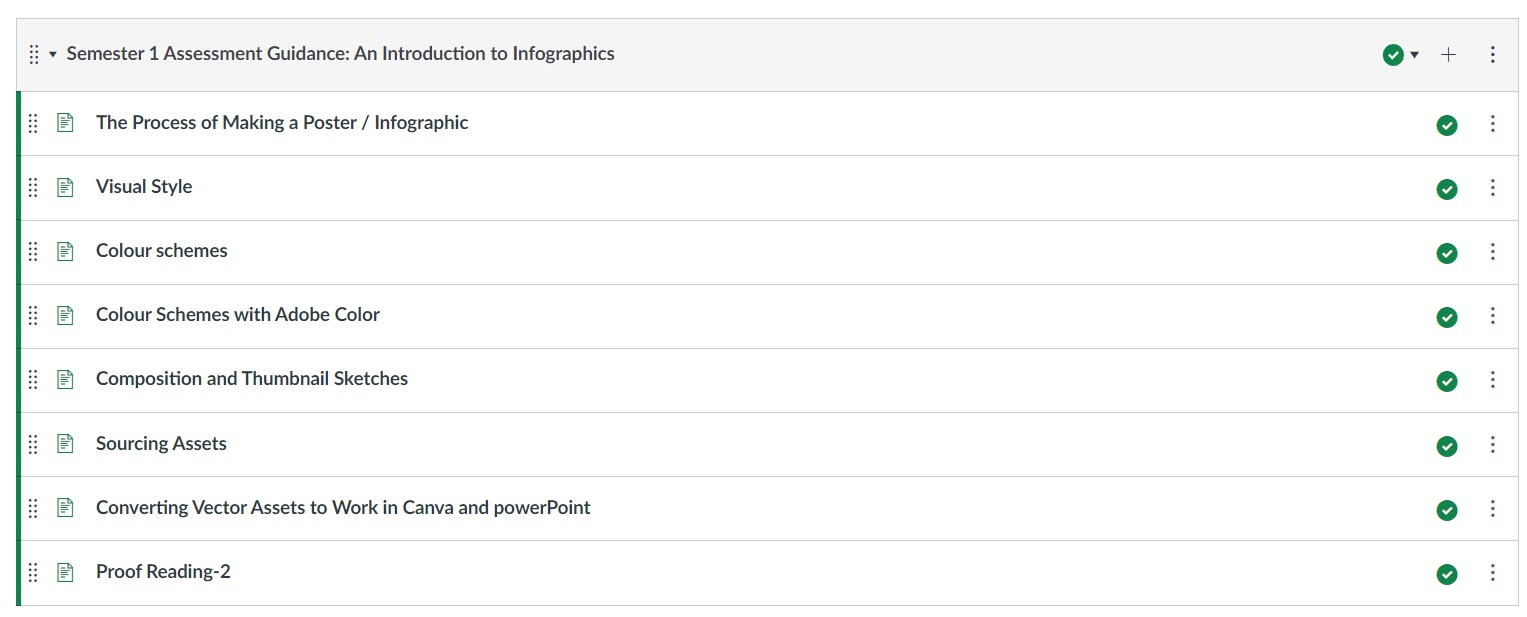
Figure 1: Video titles for the creative aspects of infographic design.
The videos were designed to take the students in a step-by-step manner through the different stages of designing an infographic, for example designing a colour scheme for the infographic, as illustrated in Figure 2 below.
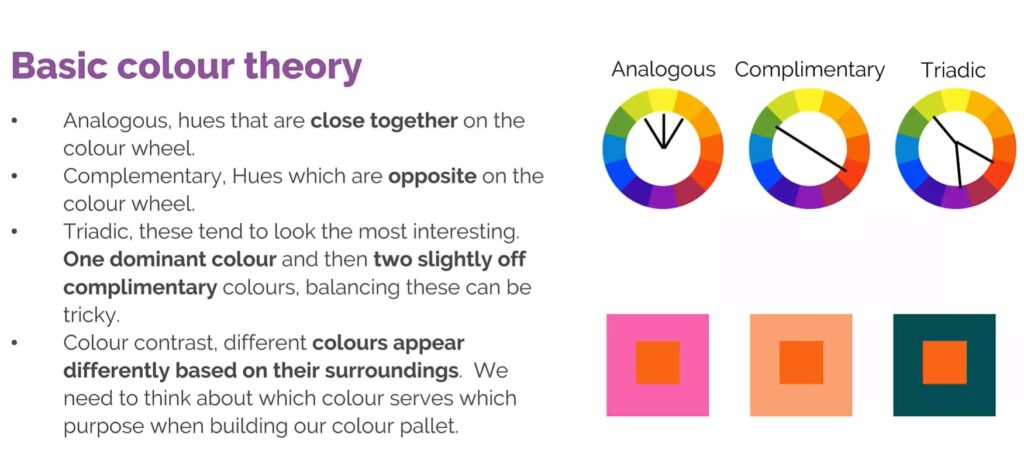
Figure 2: Screenshot from the ‘Colour schemes’ video.
In addition, a series of technical video instructions on how to create an infographic in both PowerPoint and Canva were produced. The titles are presented in Figure 3 below.
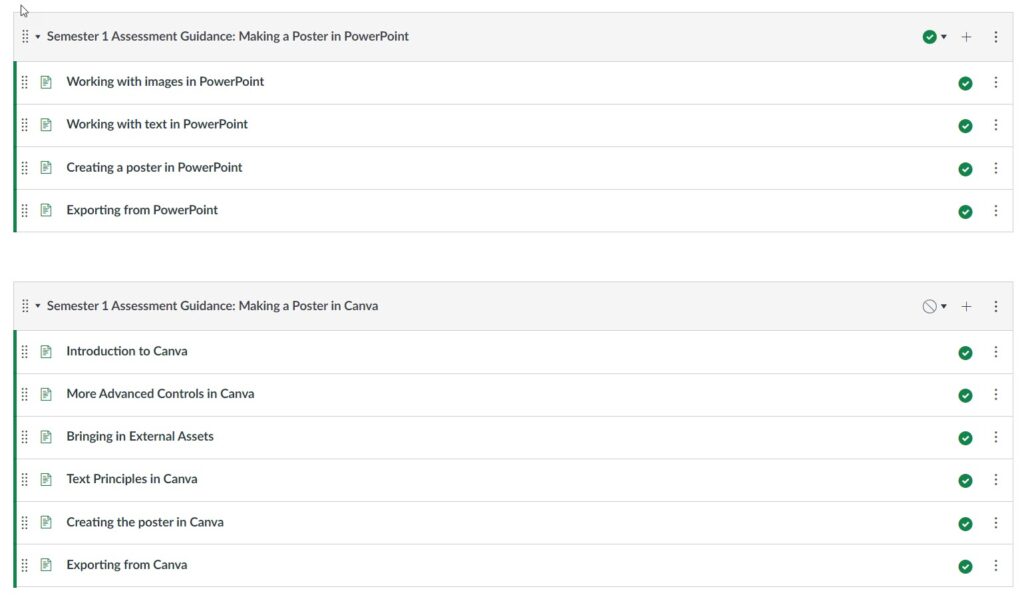
Figure 3: Video titles for the technical aspects of infographic design.
By the start of the new 21/22 academic year, the videos had been developed and these were tested in tutorial sessions with the students. Some enhancements were made to the resources following student feedback and a final set of videos were developed. The videos were located on the module Canvas site and integrated into the seminar and lecture activities on the module. Working with a specialist team who were experienced not only with the technology but also these nuanced design principles added greatly to the success of the project and gave students a realistic insight into the process and time required to complete their infographics.
Why did you do it?
As part of the annual module review process, the module team identified that the students would benefit from more guidance in terms of the creative aspects to producing an infographic in addition to the technical aspects. For example, many of the student submissions were very ‘wordy’ and lacking in graphically displayed rich information as illustrated in Figure 4 below.
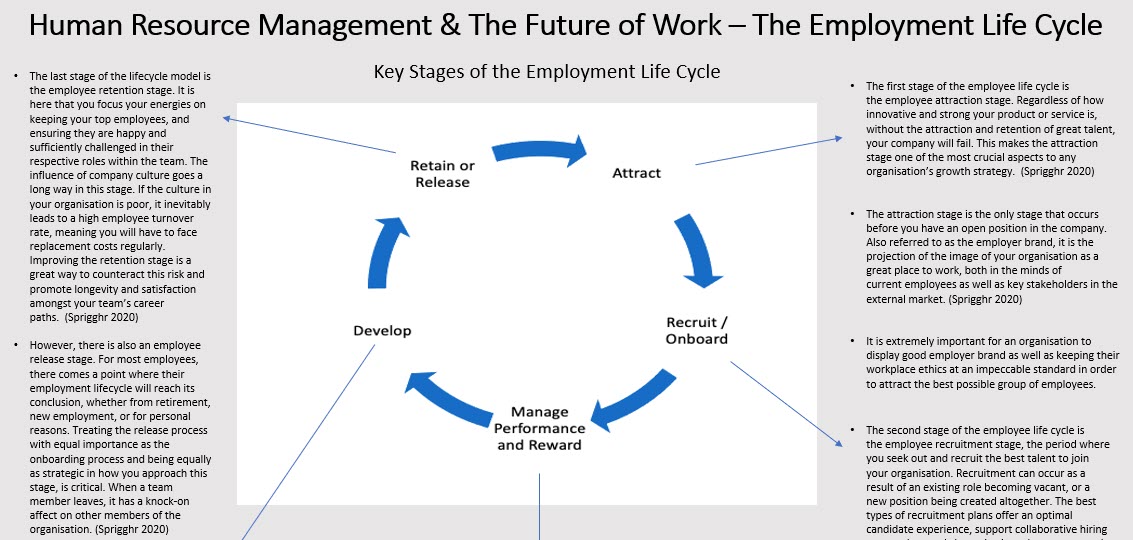
Figure 4: Infographic from academic year 2020/21.
The module team had already worked with the Library’s Academic Skills Team in delivering support to students around topics such as critical thinking, reading and writing assignments. The Academic Skills Team is based in the Library and has a remit to support students from all stages of study across all faculties. The team works with learning technologists and content creators to provides a range of engaging digital resources alongside the teaching provision the team offers, so that students can access support in a range of ways. This includes a variety of multimedia resources targeted at skills development, such as referencing, that module teams can embed into their module Canvas sites.
Often academic support is associated with support in written assessments and exams, it was also important for the team to support students and colleagues with different authentic assessment types which have been introduced on many courses, which mirror professional practices and expectations. This included the creation of digital artefacts such as infographics and video pitches.
When the Academic Skills Team met with the BUS2040 Module Leader to discuss teaching for the upcoming academic year 2021/2022, we could see an opportunity to create resources to support students to create infographic posters, which would incorporate elements of academic skills such as writing concisely along with providing students with skills to enable them to produce an infographic poster utilising the skills across our team and showcasing the versatility of our support. As assessment types are constantly evolving, it is key for our team to respond to these changes and adapt our support accordingly with an increased emphasis on creating digital artefacts.
Does it work?
The video resources have had both a quantitative and qualitative impact on student achievement on the BUS2040 module. Quantitatively, the average grade designation for this component of assessment has increased from 2:2 to 2:1. Additionally the number of students achieving a first has increased alongside the number of students failing the assessment decreasing.
The resources have also had an impact in terms of student confidence to engage with the assessment. Indeed, the Academic Skills Team’s expertise and enthusiasm for design comes across strongly in the video resources. Additionally, feedback from the students indicates that:
- they enjoy the visual nature of the resources;
- having a series of short videos enables them to ‘dip in and dip out’ of the resources as needed;
- splitting the design elements from the technical elements enables them to start their assessment earlier in terms of creating a story board in advance of the technical aspects of arranging their infographic in Powerpoint or Canva.
Furthermore, the videos also had a great impact on the quality of the submissions. Students engaged with the guidance on flow and structure, colour schemes and use of graphics to produce some highly creative and informative infographics as illustrated in Figure 5 below.
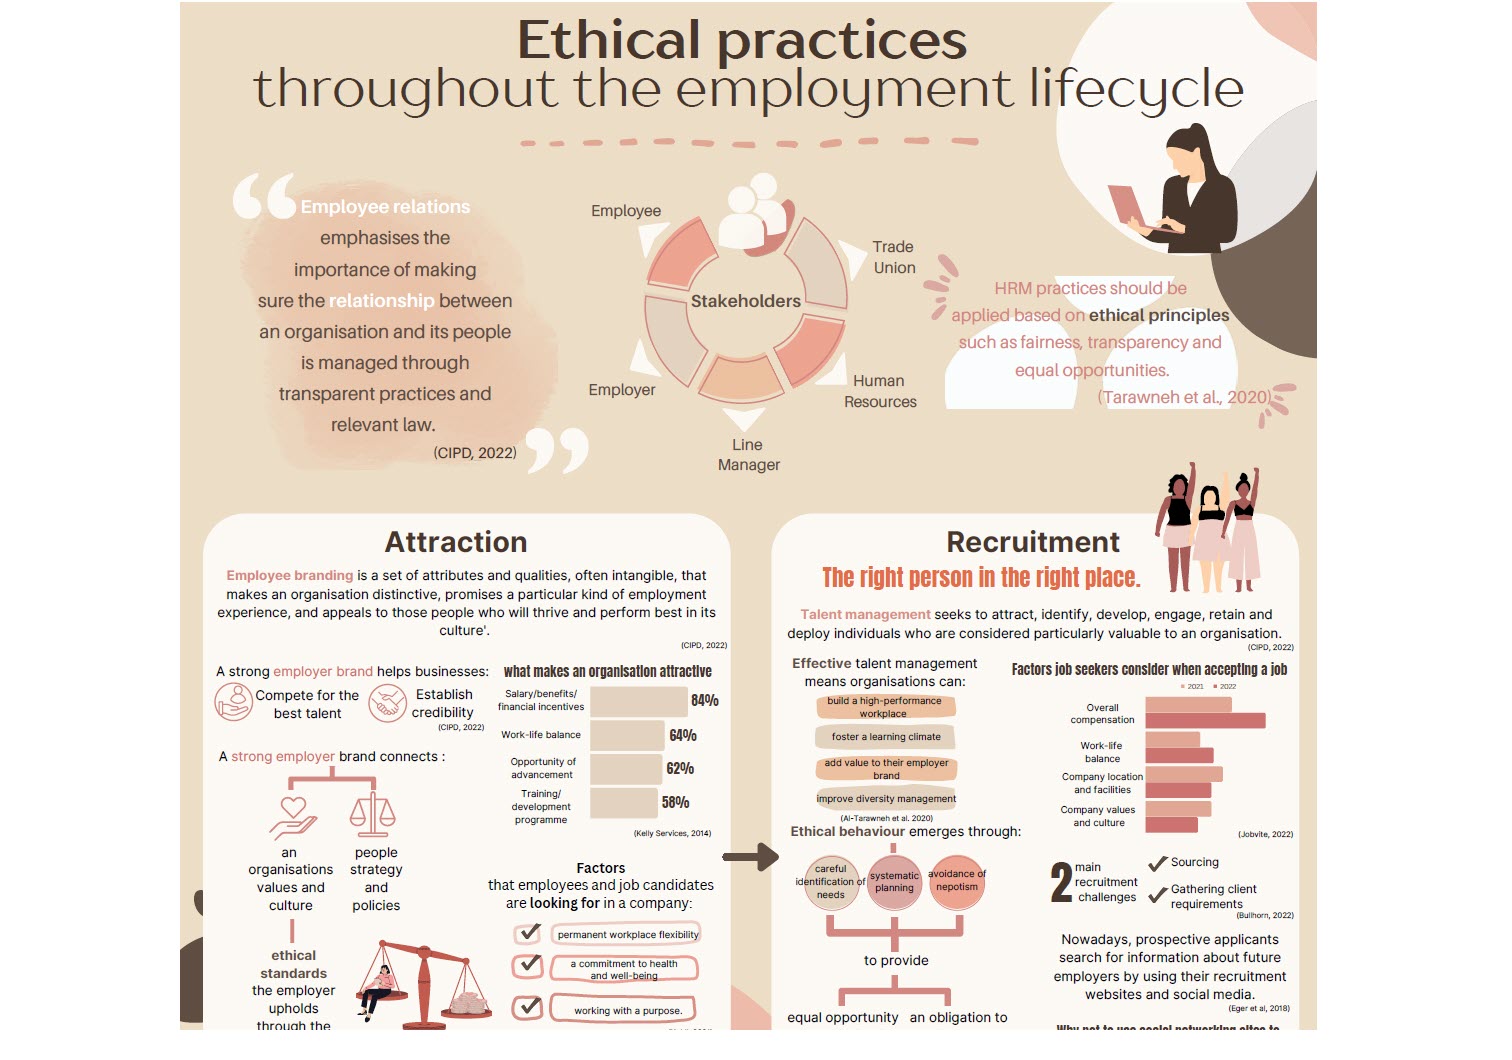
Figure 5: Infographic from academic year 2022/23.
The project fits in with several other Programme, School, and Institutional initiatives. First, since developing the set of resources these have been shared with other business module leaders interested in including a more creative style of assessment into their assessment strategies. For example, infographic elements of assessment have been adopted by the various capstone module leaders. Second, the resources have been shared internally with other Business School staff interested in developing their infographic skills.
Third, the Business School has an employability team and the resources have been shared as part of their ‘developing employability’ activities aimed at students. Finally, the University has a vibrant and supportive Academic Skills Team and in developing these resources the team have been able to add to their already extensive portfolio of skills development resources. This has impact beyond the module and Business School to the wider University. The resources were used as a basis for a self-enrol canvas course available to all students, this course not only sits on ASK, but also within Canvas courses of a wide range of subjects.
The Graduate Framework
This case study demonstrates the following attributes:
- Future focused
- Creative, innovative and enterprising
- Digitally capable
- Curious